U.S. Startup Funding Graduation Rates (Pre-Seed → Seed and Seed → Series A)
Pre-Seed to Seed Graduation Rate
Current Conversion: Recent industry benchmarks indicate roughly half of U.S. startups that secure pre-seed funding go on to raise a seed round. Specifically, about 45–55% of pre-seed–backed companies manage to “graduate” to a seed financing. This figure is a rough average; comprehensive year-by-year data is scarce, but it provides a baseline. Some venture analyses in 2023/24 suggest this pre-seed→seed conversion has dipped slightly due to tougher funding conditions. (For example, observers note many startups now require bridge rounds or venture debt to reach seed, hinting at a lower conversion rate than in boom years.) Overall, however, roughly one out of two pre-seed funded startups historically reaches the seed stage in the U.S..
Measurement Context: Pre-seed to seed “graduation” is typically measured as the percentage of startups that raise a bona fide seed round after a pre-seed. There isn’t a strict timeframe universally applied, but given typical runway lengths, many startups aim to go from pre-seed to seed within ~1 to 1.5 years. In fact, recent data shows the average time from pre-seed to seed is ~18 months. This means most companies that do graduate will do so within a year or two of their pre-seed raise. (If a startup takes significantly longer, it may indicate difficulties in reaching seed or a pivot to alternative funding.) It’s worth noting that what constitutes “pre-seed” vs. “seed” can vary – often pre-seed is an angel/SAFE round under ~$1M, whereas seed rounds are larger, institution-led rounds. Despite these nuances, the ~50% conversion benchmark gives a directional sense of the odds.
Factors and Trends: The ~45–55% rate is an aggregate and can vary by sector and other factors. For instance, startups backed by top-tier VCs or those in hot sectors might exceed the average, whereas others may fall below. During the 2020–2021 boom, ample angel money likely kept the pre-seed→seed graduation fairly robust. But by 2023, with angel activity cooling and investors more selective, even strong teams sometimes raised extended pre-seed rounds (or multiple SAFEs) before a seed – effectively raising the bar for graduation to Seed. Regional differences are less documented at pre-seed, but the West Coast dominates pre-seed activity (nearly 50% of U.S. pre-seed capital goes to Western states, with ~40% in California alone). This concentration could implicitly boost conversion in those hubs (due to denser investor networks), though hard data by geography isn’t publicly available. In summary, roughly half of pre-seed startups make it to seed overall, but that rate may be drifting downward as investors tighten standards.
Seed to Series A Graduation Rate
Historical vs. Recent Rates: The graduation rate from Seed to Series A has dropped sharply in the past few years. Historically, a sizable minority of seed-funded companies would reach Series A. Multiple sources peg the past average around 35–40% of seed-funded startups eventually raising an A round. In fact, in strong cohorts a few years ago, conversion within ~2 years could be even higher – on the order of 40–50% in the best cases. For example, Carta data shows that for startups which raised seed in Q2 2020 (a cohort that largely sought Series A in the frothy 2021–22 market), about 40% made it to a Series A within two years. Some earlier seed cohorts (2017–2019) ultimately saw 50%+ reach Series A within ~4 years. These were the “strong clip” graduation rates in a favorable funding era.
2021–2024 Collapse: In contrast, 2022–2024 cohorts are seeing dramatically lower conversion. Startups that raised seed in 2021–2022 are advancing to Series A at only a fraction of the historical rate. Crunchbase tracked U.S. companies by the year of their first $1M+ seed round: of the 2021 seed cohort, only ~36% have so far graduated beyond seed (i.e. raised Series A or later, or achieved an exit). For the 2022 seed cohort, only ~20% have progressed to an A or beyond as of late 2024. This is a huge drop versus prior years (2017–2020 cohorts saw about 51–61% eventually get to Series A or an exit). Carta’s data (based on cap table records) shows a similar trend when measured on a 2-year timeline: 30.6% of companies that raised seed in Q1 2018 made Series A within two years, but only 15.4% of those that raised seed in Q1 2022 did so in the same 24-month window. In other words, the conversion rate halved in just a few years. Early indicators for the 2023 seed cohort are even bleaker – one analysis found that after 8 quarters (two years), only ~15% of startups that raised seed in early 2023 reached a Series A by early 2025. And at the one-year mark, the 2022–2023 cohorts were virtually flat – e.g. just ~5% of 2022 seed companies had raised an A within ~20 months (versus ~23% of 2020 seed companies at a comparable point). All data points confirm a steep decline in seed-to-A graduation rates in 2022–2024. Today, investors grimly joke that “95% of seed startups won’t make it to Series A,” as recent cohorts hover in the mid-teens percentage-wise.
How Graduation is Measured: Typically, seed→A graduation is tracked over a defined period (often 24 months) to gauge how many startups secure Series A within two years of their seed round. This “within 2 years” metric is common in VC analyses, since most companies that can raise an A will do so in roughly 12–24 months if the market is healthy. Of course, some startups raise Series A later than two years (especially in slower markets), so eventual lifetime conversion could end up a bit higher than the 2-year stats. For instance, Crunchbase’s 36% for the 2021 cohort (above) counted those who made it to Series A by late 2024, roughly 2.5–3 years out. But even allowing for longer timelines, the trend is clear: companies are taking much longer to get from seed to A, and many are not getting there at all. The average time between a Seed and Series A round has stretched to over 2 years in 2024, up from about 1.5 years in the late 2010s. Carta’s data shows this plainly: circa 2019, time from seed to A was ~1.7 years, whereas now it’s well above 24 months on average. This elongation means lower 2-year graduation percentages (since many startups need more than 2 years to hit metrics for an A, if they manage at all). Some are raising “Seed+” bridge rounds to buy extra time – by late 2024, nearly 40% of all seed/Series A financings were insider bridge or extension rounds rather than new priced rounds. These bridges can keep a company alive, but they also indicate that an official Series A is not coming as quickly as before.
Sector and Geography Variations
Graduation rates can vary widely by industry and other factors. Certain sectors simply have different funding dynamics. For example, life science and deep-tech startups often raise larger seed rounds and may take longer to reach product milestones, potentially leading to longer timelines (or lower 2-year conversion rates) for Series A. In contrast, a hot sector like AI in 2023–24 saw strong investor appetite even at seed – these startups might find it slightly easier to attract Series A funding (provided they show traction) than, say, a consumer app in the same period. Indeed, commentators noted that the 2023 AI funding boom crowded investor attention, possibly making non-AI startups struggle more to graduate to A. Quantitatively, one report by J.P. Morgan noted seed→A graduation rates ranging from as low as “1 in 10” (10%) to as high as “1 in 3” (33%) depending on the sector and market conditions. In other words, a capital-intensive sector facing investor skepticism might see only ~10% of seed companies make it to A, whereas a more favored sector (or era) might see ~30% succeed. Geography within the U.S. appears to be a secondary factor, but it’s worth noting that the strongest ecosystems (Silicon Valley, NYC, etc.) historically produce more Series A winners simply due to concentration of talent and capital. For instance, California and New York together account for a large share of seed-stage funding, which correlates with a large share of Series A rounds. That said, we don’t have specific published “Series A conversion by state” statistics – the regional effect likely manifests through network advantages (e.g. Bay Area startups have more nearby VCs to pitch).
Finally, the quality of investors and round size at seed also influences graduation. Startups that raised bigger seed rounds or gained backing from top-tier VC firms tend to have higher odds of reaching Series A. These signals of quality (and extra capital runway) can bolster a company’s ability to hit milestones and attract an A. Conversely, companies that scraped by with small seed checks or less prominent investors may face a tougher road. In the current climate, investors like Forum Ventures observe that standards for Series A are much higher – often requiring meaningful revenue or traction – so only the most promising seed-stage startups graduate, regardless of sector or region. As Michael Cardamone (Forum’s CEO) put it, “graduation rates from Seed to Series A [are likely to] continue to decline” in the near term, reflecting a new normal where fewer companies make the cut.
Key Takeaways
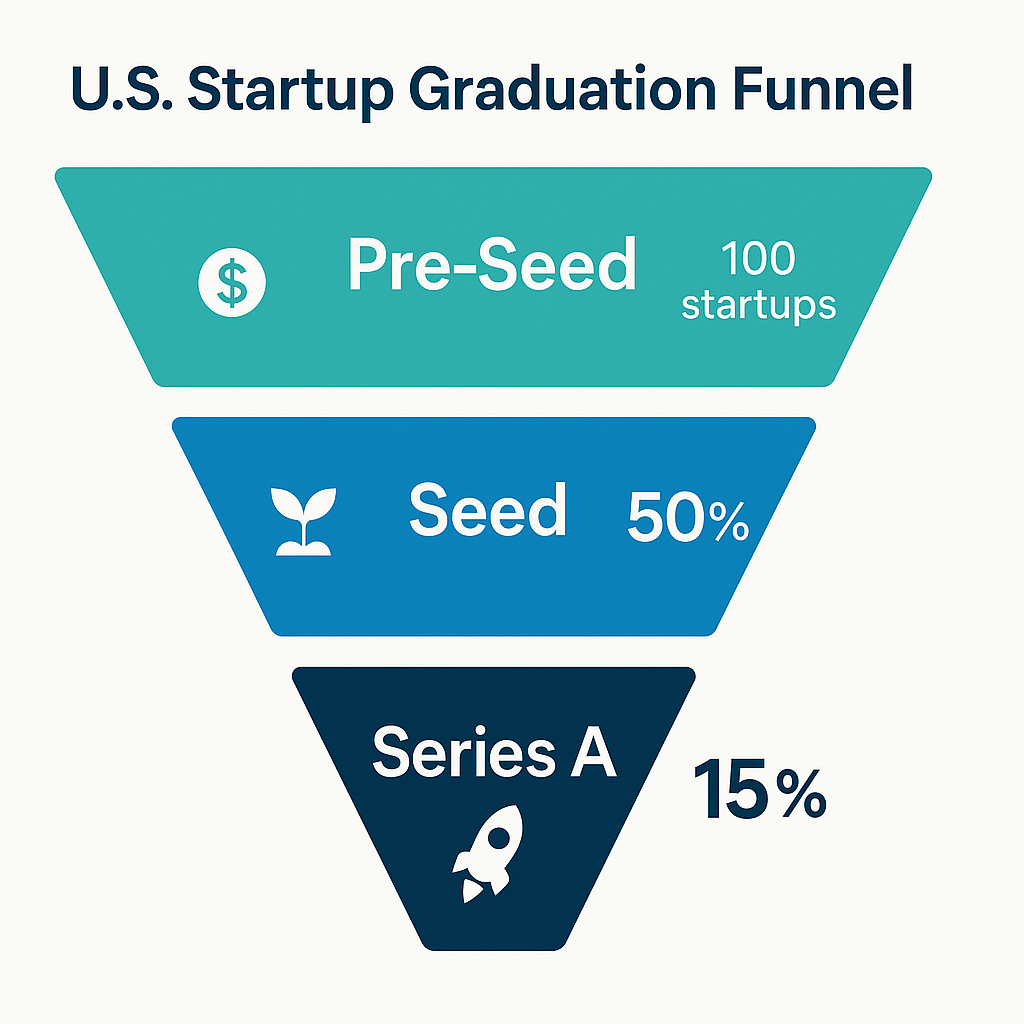
- Pre-Seed → Seed: Roughly 50% of U.S. startups raise a seed round after a pre-seed. This rate has been relatively high but could be softening in the 2023–24 cycle. Pre-seed to seed typically takes ~12–18 months on average.
- Seed → Series A: Historically on the order of 30–40% of seed-funded companies would reach Series A. Today, that “graduation rate” has plummeted – recent cohorts show only ~15–20% making it to A within ~2 years. The drop is stark when comparing 2020 vs. 2022 seeds (e.g. 40+% vs. mid-teens conversion). Startups are also waiting >24 months on average for Series A in 2024, versus ~18 months a few years ago.
- Year-by-Year Trend: 2020 seed cohort – roughly 20–25% reached Series A within 2 years. 2021 cohort – around 17–36% reached A (estimates vary by data source and timeframe). 2022 cohort – only about 5% made Series A in ~1.5 years, likely ending around 15–20% by 2+ years. 2023 cohort – too early to tell, but on track for similarly low conversion (mid-teens percentage). The overall direction is down year-over-year through 2022, with hopes that 2024–2025 might stabilize or improve if the funding environment recovers.
- Contextual Factors: Graduation rates are measured as a combination of timing and eventual progression. A low 2-year conversion doesn’t always mean a startup failed – some may just raise later. But many seeds are stalling out, given the funding pullback. Sector-wise, conversion can range roughly 10%–33% from worst to best segments. Geography within the U.S. correlates with activity levels (California being a powerhouse), but success is still determined case by case. In all, the Series A funnel has tightened considerably post-2021, raising the bar for startups and prompting investors and founders to adapt (by cutting burn, extending runway, and focusing on clear product-market fit before attempting to “graduate” to the next round).
Sources: Recent Crunchbase analyses; Carta’s startup/fund data reports; industry research via Antler (synthesizing PitchBook, CB Insights, etc.); and Forum Ventures/Carta commentary on 2024 trends. These sources encompass 2023–2025 insights and reflect the latest available data on U.S. startup funding progression.